Project Description
This project was about creating a custom memory manager. The memory manager uses a custom algorithm that attempts best-fit first, followed by worst-fit.
The memory manager contains a custom debug window with stats of the runtime allocations.
The custom memory manager was up to 10x quicker than native new and delete. Allocations could take as little as 2-4 nanoseconds for small primitive types.
The custom instrumentation timer and profiler were used to identify bottlenecks in my game and improve times.
For a full breakdown with graphs feel free to view the document:
Instrumentation Timer
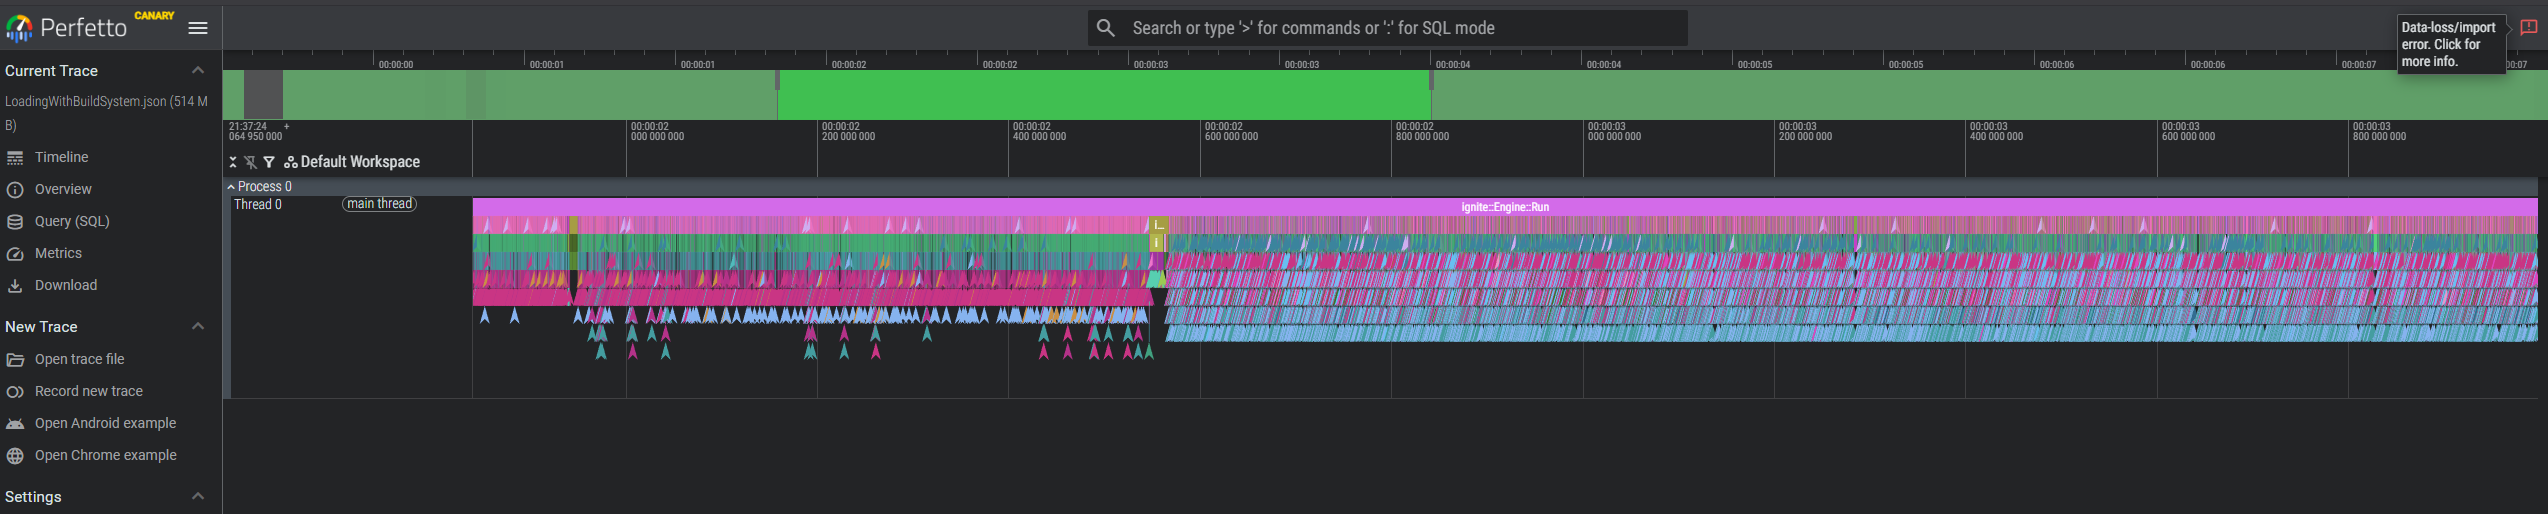
A Custom Instrumentation timer was written to capture times and output them to the hard drive. The times were recorded by using the scope of a function and then flushed to disk using a separate thread to mitigate recording overhead.
The instrumentation timer helped to analyse the gameplay and how it was performing at runtime.
Due to allocations being nanoseconds, this wasn't a good way to benchmark but rather identify key hotspots and throttle points.
These times could be loaded in https://ui.perfetto.dev/ and viewed:
Profiler
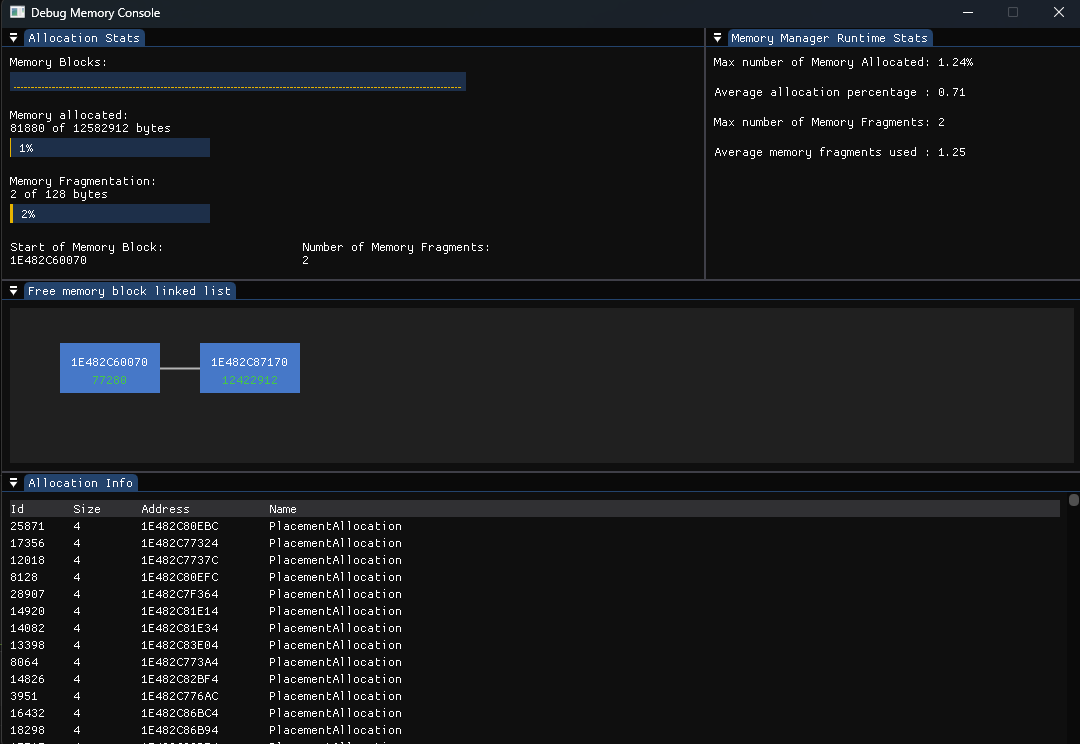
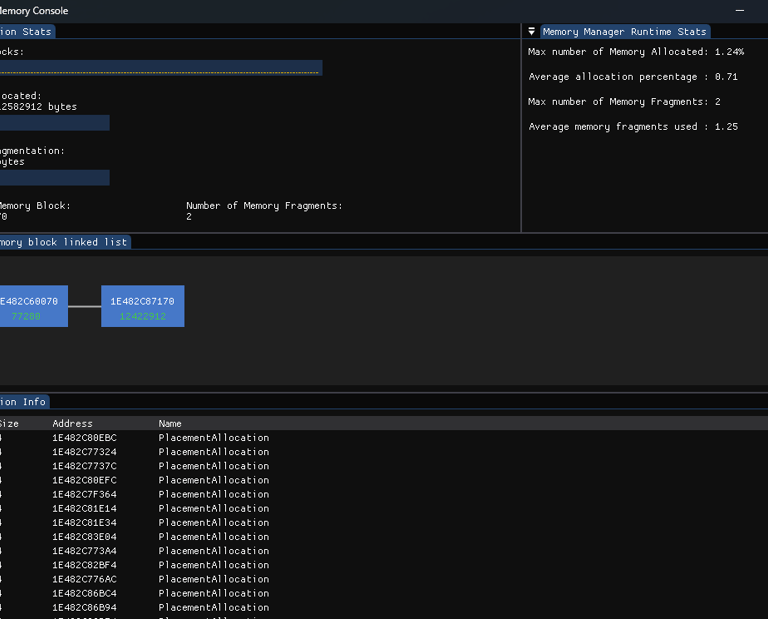
A debug memory profiler was implemented to allow for live viewing of the memory.
This profiler showed the memory blocks as a list so that the developer could identify and the current memory fragments and their size.
Additionally there are live stats giving a break down of the maximum and running averages of memory fragments and total allocation sizes. This was used to help identify how much memory was needed for the application as well as how fragmented the algorithm caused the memory to be.
A full allocation list was also displayed so that the developer could identify what the memory was allocated to:
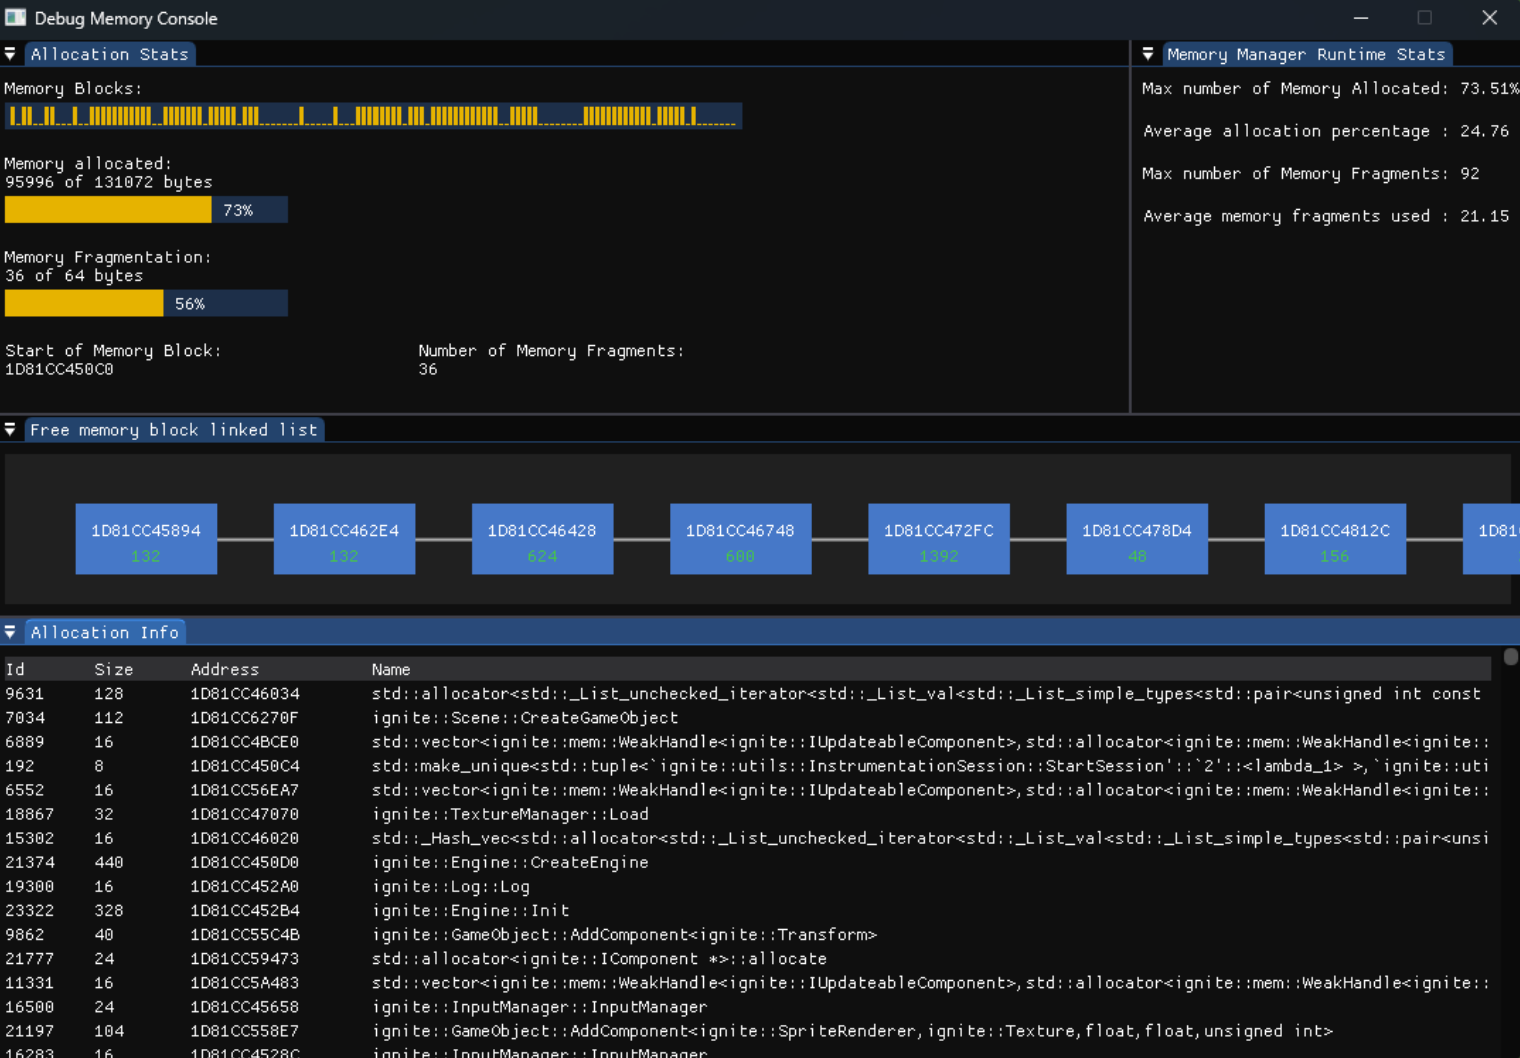
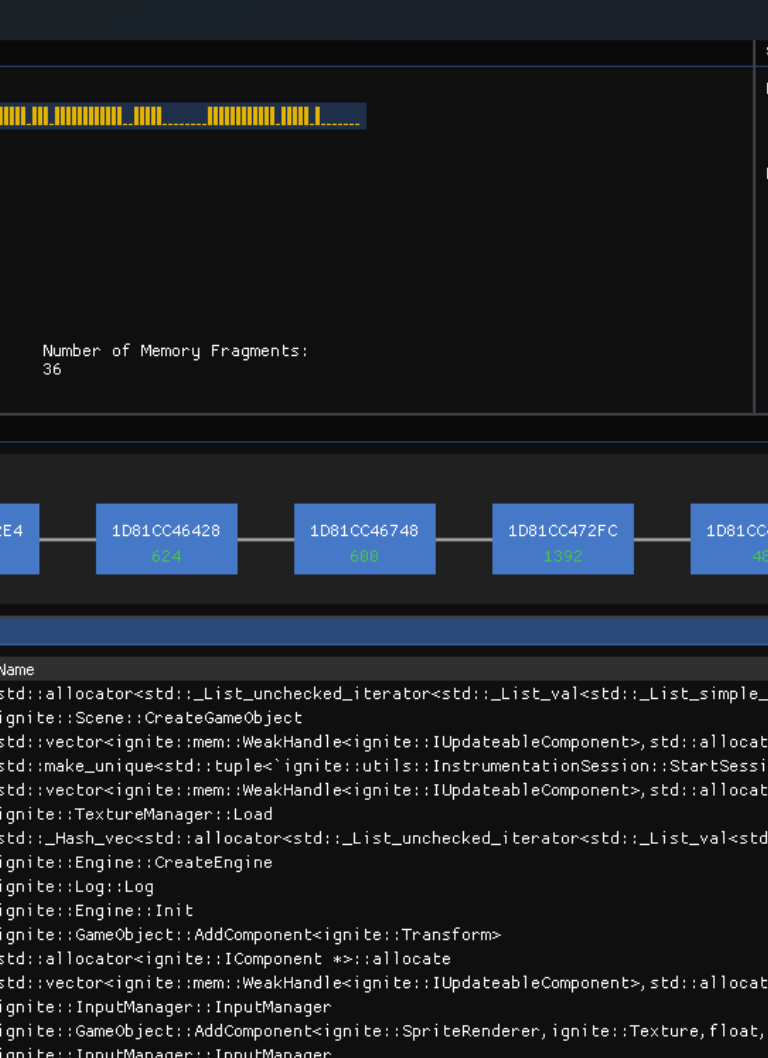
This debugger was exceptionally helpful during the development of the memory manager. Assisting to find bugs, edge cases, as well as visualise what was going on in memory.
This was integrated into the benchmarking stats to view the performance of the tests. Whilst this isn't super beneficial due to the time it takes, there were some unit tests that this allowed for stepping through and confirmation of the memory state visually:
Custom Python Scripts
Custom python scripts were used to assist with statistical analysis of the results from the instrumentation tests. An interactive graph pie-chart can be generated allowing users to step into deeper levels of the stack and find what is taking the most allocation times. This was my attempt to create a similar experience to superluminal performance captures.
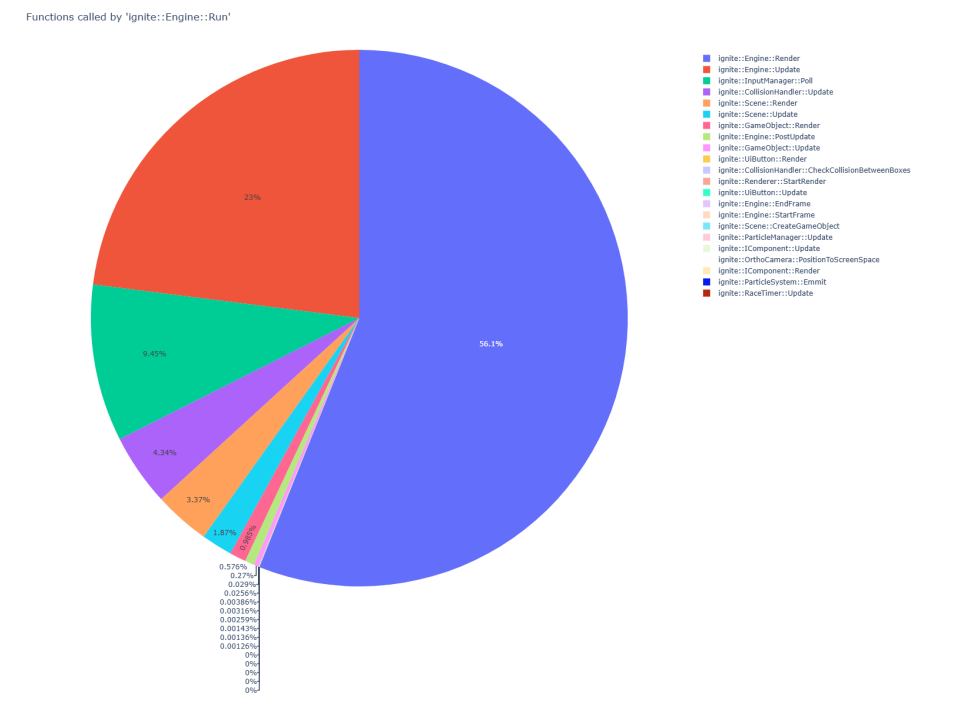
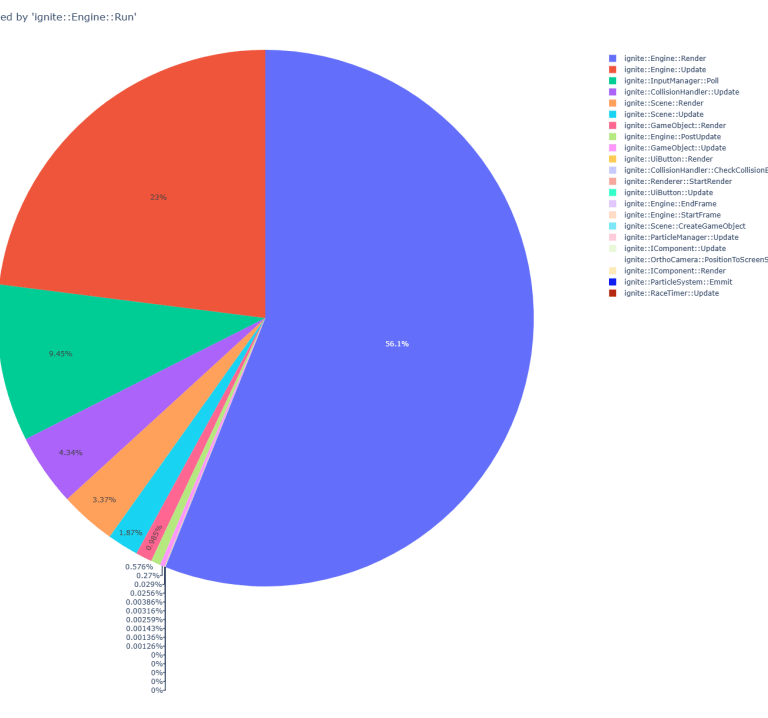
An image showing an example of the pie chart showing allocation times:
The instrumentation timeline visualisation assisted to find a "bottleneck" for loading the Level. The levels were based off tile maps with tile and collision information. This was stored as an XML which required runtime parsing, even though the final game would guaranteed have these levels.
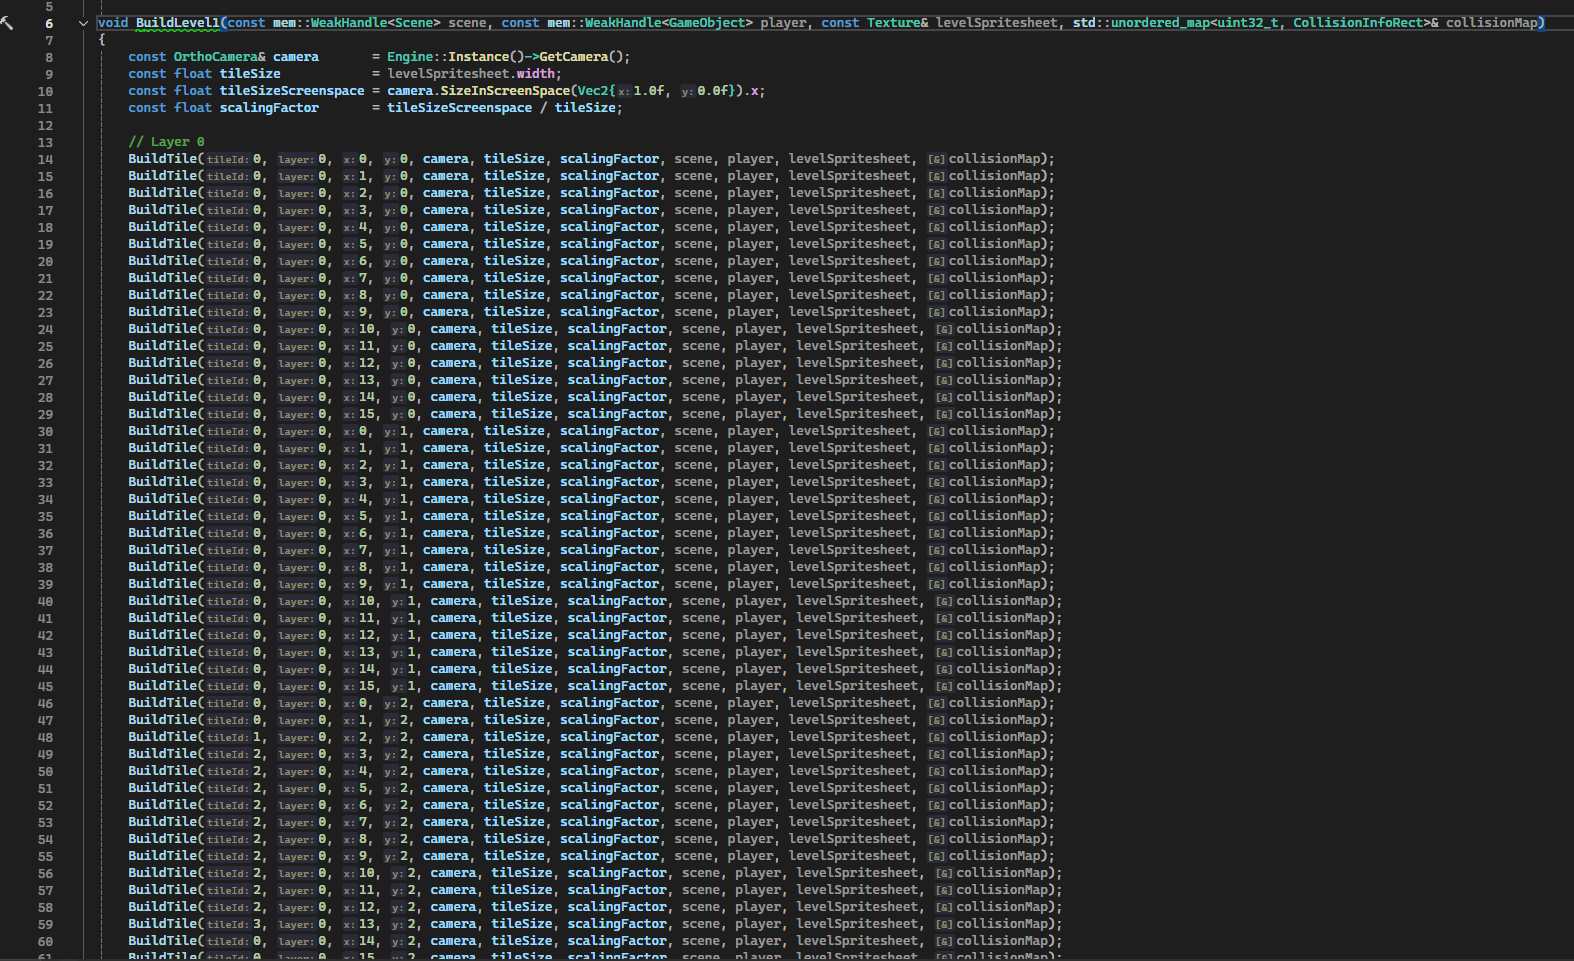
To help optimise the runtime, a custom python script was used to parse the XML and convert it to C++ code allowing for 0 runtime parsing.
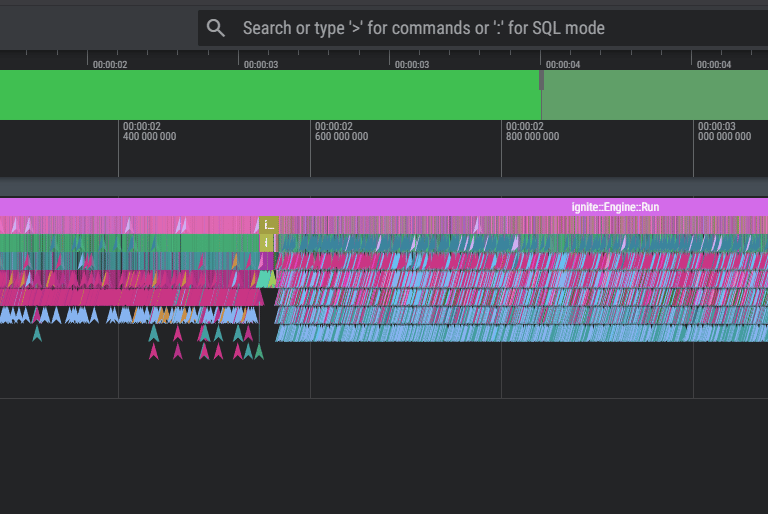
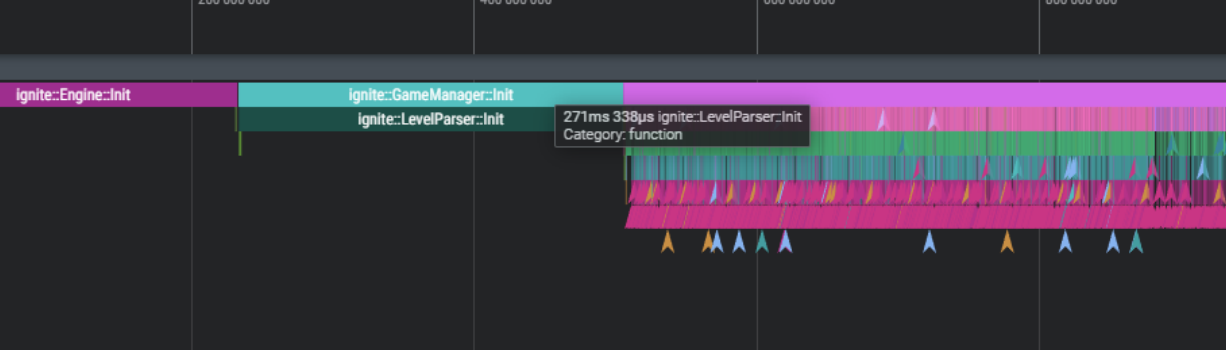
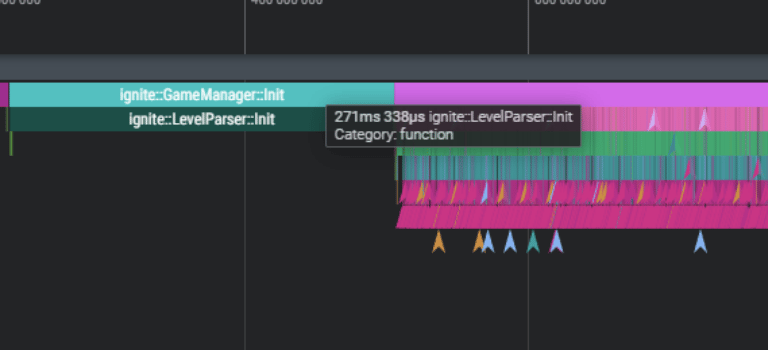
A screenshot of the instrumentation timeline before:
A screenshot of the instrumentation timeline after:
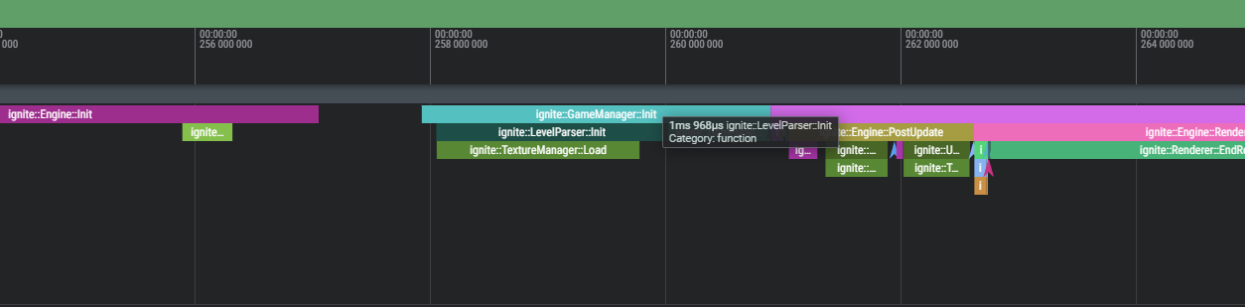
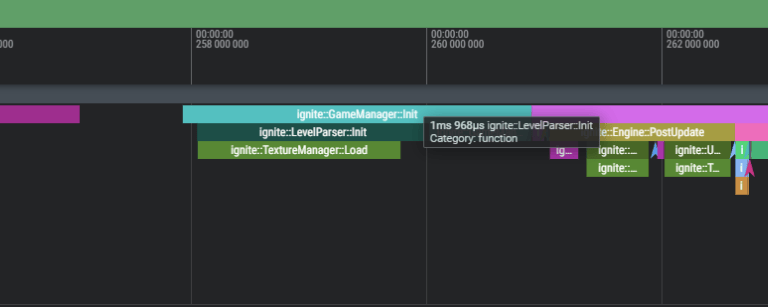
A screenshot of the instrumentation timeline after:
From 271ms to 2m - over 135 times faster.
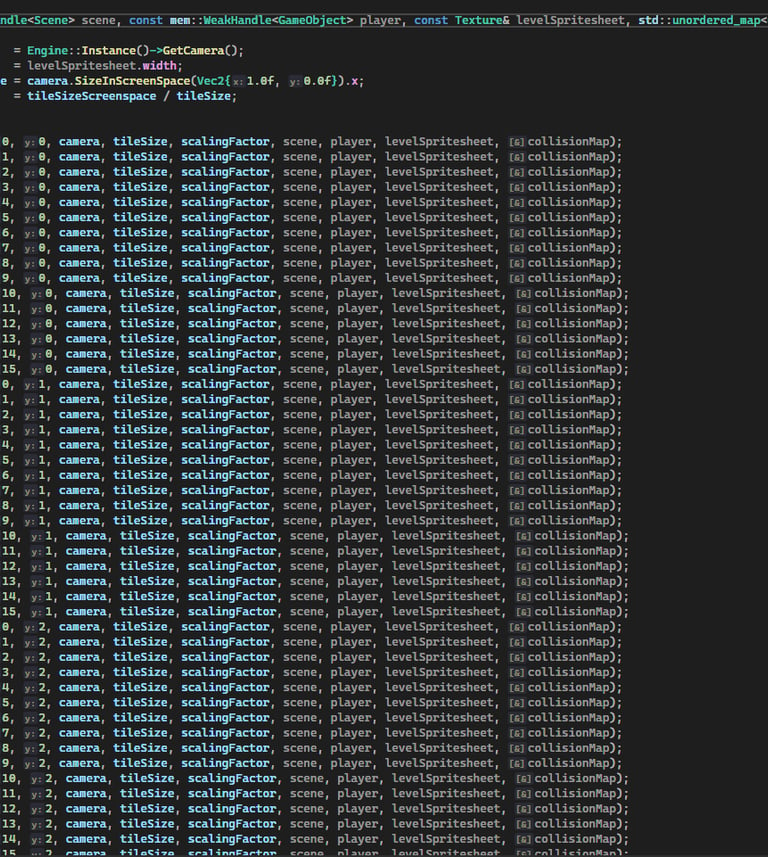
An example of the output built level, building the types by layer with the given positions scraped from the XML:
Benchmarks
Various tests were run to try test under different circumstances. 20,000 allocations were completed and timed, this was repeated 2,000 times and the times were used to compute an average.
The different tests:
Small primitive type (unsigned int)
Small Component (32 bytes)
Medium Component (64 bytes)
Large Component (256 Bytes)
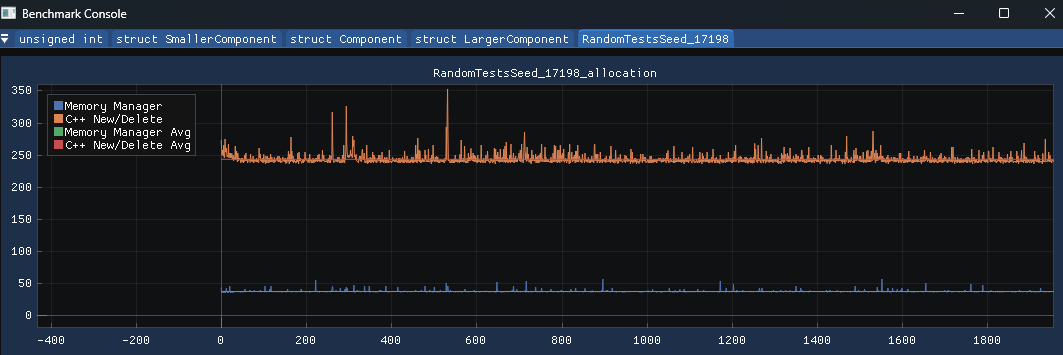
Random seed - randomly allocate and deallocate. This was a fixed seed to allow for the same test with native C++ new and delete.
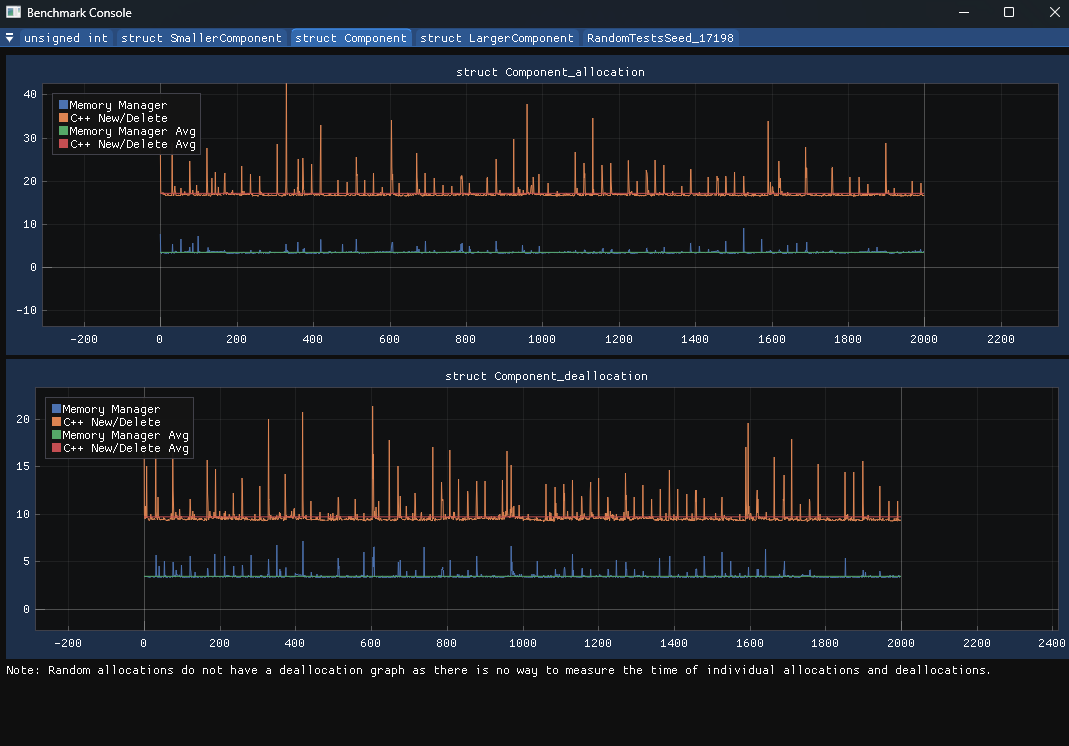
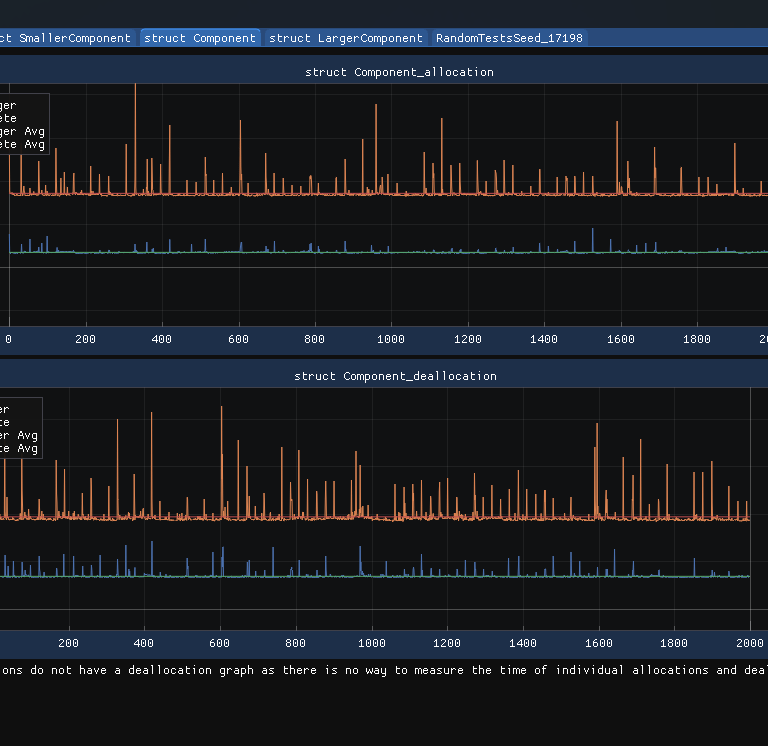
Images showing some results from a test (x-axis is the test and y-axis time in ns):

Tests
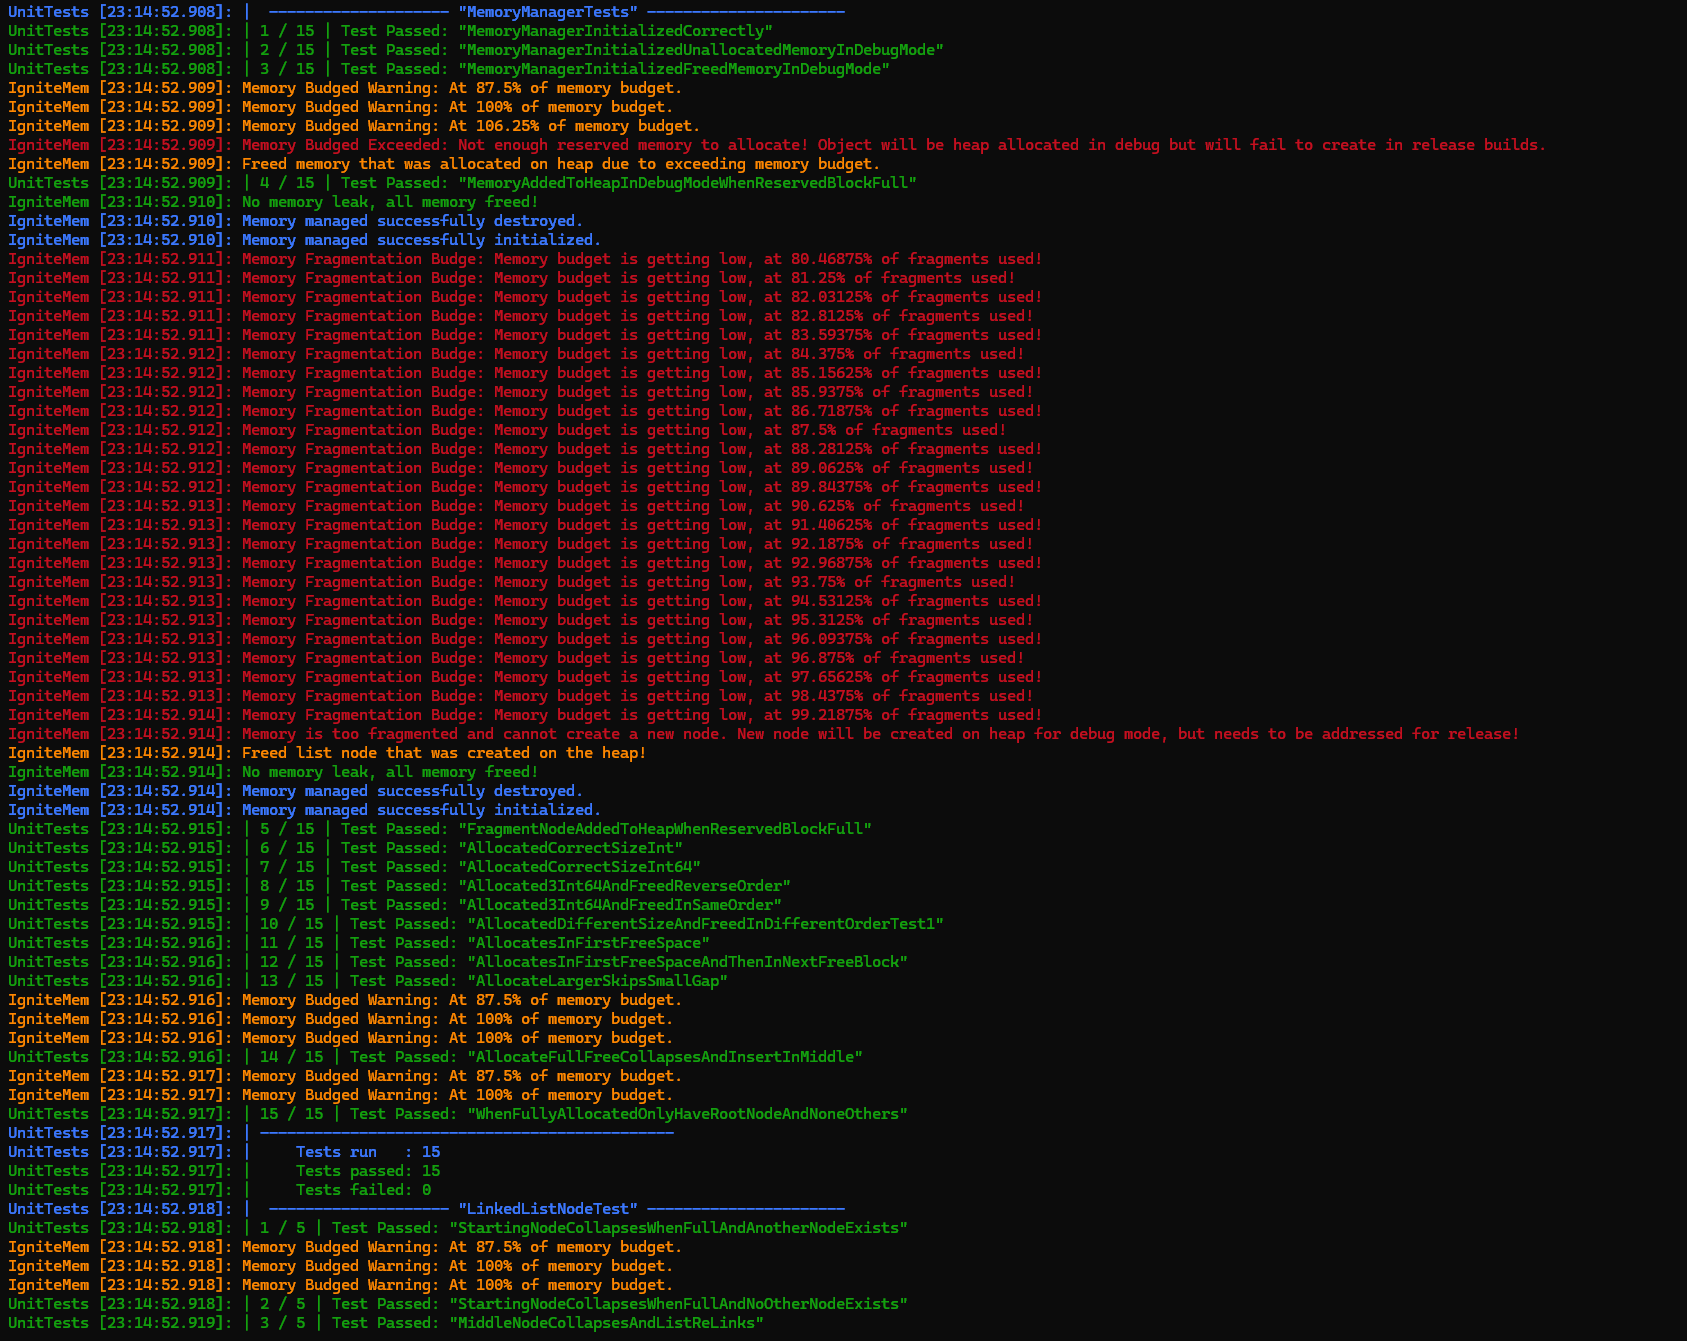
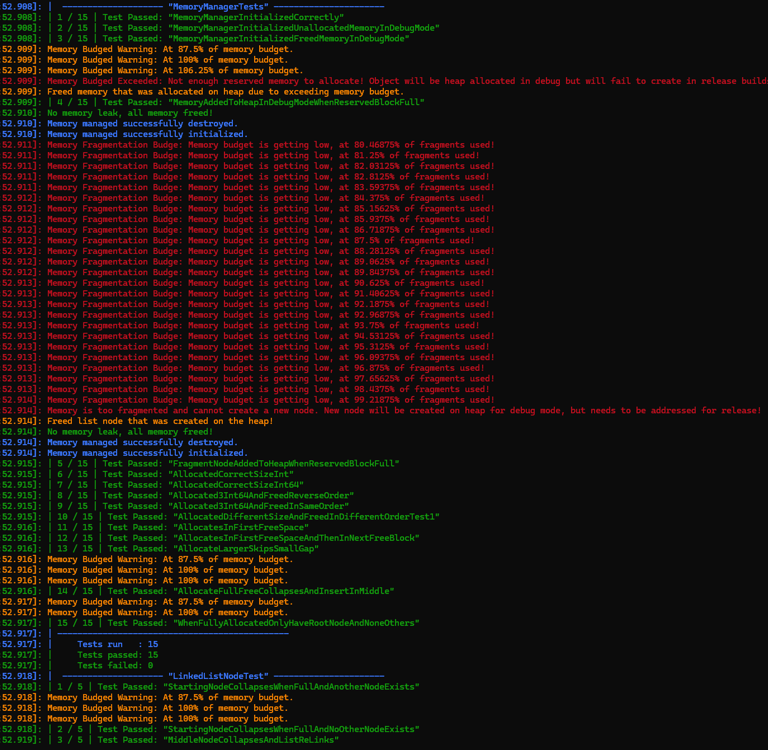
Due to being so low level and a critical system, unit tests were written whilst developing the memory manager. This allowed for easier development as well as confidence in the memory manager. As bugs and edge cases were found, more tests were added to cover those cases.
In debug mode the memory manager would over allocate memory, and if the capacity was exceeded, it would heap allocate. Tests were added to ensure that this was logged and correctly cleaned up/handled.
An screenshot of some of the unit tests for the memory manager: